Introduction
Recently, I got my hands on a not-every-day piece of electronic instrumentation, a so-called power analyzer LMG670 by company ZES Zimmer. I was told “it’s just a big multimeter” and I could use it to test power efficiency of our system. Power analyzer allows us to measure voltage, current, power and all relatable values on one, two or three-phase systems. I decided to take it out for a little walk. Maybe even test some EMC filters on my way.
The idea behind this article was not to advertise our device in the first place, but to show some cool capabilities of an instrument that many people haven’t seen before.
Connecting the PA LMG670 to the 3-phase system.
My colleague was not wrong – the power analyzer is actually a big multimeter. Its measurement interface is basically amperemeters and voltmeters, and the computer inside multiplies volts and amps to provide us watts. The big difference, though, is that PA measures time dependent values, with a bandwidth of 10 MHz. This makes it possible to checkout the waveform as well as frequency content of the input and output power.
I needed this machine to get some insight in power efficiency of our device. It was switching mode beast that is designed to deliver 20 kW of pure DC power. Naturally, the DUT takes its power from the 3-phase grid, that in Europe is 50 Hz 400 Vrms line. You can imagine how scary large numbers we’re talking about here. The device like LMG670 with a full dynamic range of 500 µA to 32 A / 3 mV to 1000 V per channel seemed fit for our little beast.
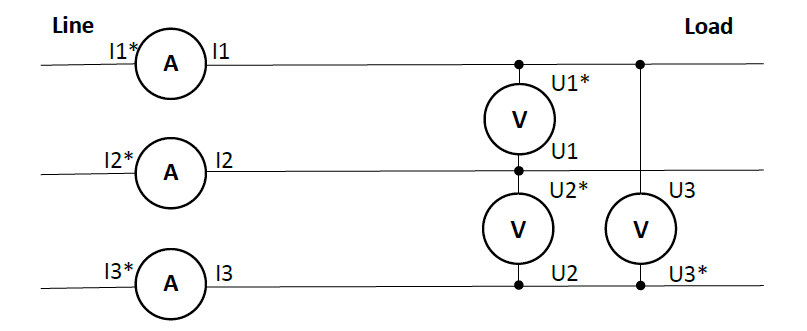
First thing, attach three amperemeters and three voltmeters, using bunch of cables and small box with banana connectors. Don’t get confused and burn something on the way! The custom-made box is there to elegantly and danger free intercept hot wires of the power cable.

Measuring something
The machine has 4 measurement channels, and each channel measures current and voltage. The ports are accessible from the backside. The channels can be grouped in two groups. By default, group 1 consists of first three channels (suitable for 3-phase systems) and group 2 contains only one.
The moment machine is up, and DUT plugged in, we’ll see some measurement results. Default display are RMS values of U & I, real power P, and ground frequency. Choosing buttons “voltage”, “current” or “power”, we can see more details about each parameter, such as RMS, DC component, AC RMS value, peak-to-peak and some other values. When it comes to the power, we can see real, reactive and apparent power as well as power factor (cosine of the angle between real and apparent power).


The first thing that caught my attention was the asymmetric active power on each phase: 5, -89 and -82 W, respectively. What the heck does it mean? Phases 2 and 3 do not dissipate but create power? Why is the power on P1 so much out of proportion (5 W) with powers on P2 and P3 ( ~80W)? Soon, I’ve found the reason for this weird behavior. Default measurement setup is set as “direct”. This kind of setup will yield the wrong value for the calculation of true power because it treats voltages as if they are referenced to the common ground (neutral wire). But this is not the case, according to our wiring diagram. The correct way to represent the power is by assigning UΔ-IY measurement ( delta – star). Power values will be meaningful afterwards.
Cool drawings

Nobody likes mundane numbers, and that’s why this cool device enables us to see some lovely graphs. We can choose multiple display options – the first one being obviously time diagram of 3-phase voltage, current and power. Here we see all non-linear beauty of switching mode power supply devices. While the voltage still maintains its neat, curvy sine waveform, the current is a total mess. Talk about beauty standards in waveform depiction.

The most obvious thing to check out next would be spectral content of each waveform. This is possible with LMG670, up to certain degree. The LMG670 doesn’t show continuous spectrum as ordinary spectrum analyzers would. Instead, it deals with harmonics. It detects native grid frequency and displays its harmonics. On the voltage side, we can see some 10-15 significant harmonics, but with the current, there are hundreds of them!


To make it even cooler, we can also see phasor diagram of the 3-phase voltage and current. There is a clear 120° separation between phases and current is a bit offset behind the voltage a bit less than 90°. What did we learn in school – what kind of impedance is it? Capacitive or inductive?

Efficiency
All of above is nice and useful, but not really what I came for. I wanted to apply certain load on our DUT and measure power at the output. Dividing Pout with Pin, I might get efficiency of the DUT.
This model of LMG670 has one more channel left, that by default belongs to the group 2. I’ve cut my output cable and connected it to the channel’s amp- and voltmeter. By setting up certain duty cycle and 10 Ω load, I was able to measure output power as well as maximum power efficiency. Here we can see that device sinked ~1kW of power and delivered ~600W, thus being only 56% efficient. It may seem like the terrible device we have made, but keep in mind it was only the test example and that true performance of the DUT lies with in kW load range.

